Introduction
Process hazard analysis (PHA) studies are essential for protecting people, property, and the environment from the catastrophic risks of process safety accidents. PHA studies contain a wealth of information from which insights must be extracted to aid in risk management. Unfortunately, PHA studies contain so much data that a manual review cannot yield insights into their results. Fortunately, valuable information can be extracted using metrics that consider all the contents of a PHA study.
Metrics can be used to evaluate the contents of PHA studies to address the safety of processes and the quality of studies. Measures of process safety and study quality can be compared with norms to identify possible departures that may need to be addressed.
PHA safety metrics are measures that provide insights into the origins and nature of risks for a process. Safety metrics can also identify when process risks depart from those typical of other processes. Examples of safety metrics are the number of safeguards per scenario, and the percentage of scenarios with high risk.
PHA quality metrics are measures that provide insights into how well PHA studies are conducted. Quality metrics can identify inconsistencies in PHA results for different units, processes, technologies, or facilities, which can be used to improve studies. Examples of quality metrics are the number of HAZOP deviations per node, and the number of causes per node. Quality metrics can identify inconsistencies in PHA results for different units, processes, technologies, or facilities, which can be used to improve studies.
The purpose of using such metrics is to monitor and assess the safety of a process and the quality of a PHA study performed on a process in order to focus attention on and drive improvements in the safety of processes and the quality of PHA studies.
An important aspect of using metrics is presenting information in a visual form that facilitates comprehension and understanding of PHA study results in a way that is not possible simply by reading PHA worksheets. Data visualization is a key aspect of ensuring the utility of metrics.
This article describes various safety and quality metrics for PHA studies and provides examples that illustrate their use.
Safety Metrics
PHA practitioners usually focus attention on the risks of individual hazard scenarios in order to identify needed risk reduction measures. However, this practice misses the big picture of risks for a process. Safety metrics provide integrated measures of risk across a process which provide a much better and more informed basis for decision making on process risks.
Hazard scenarios that are identified in PHA studies are characterized by various elements, such as an initiating event, intermediate events, enablers, consequences, safeguards, and risk rankings and/or risk estimates. Recommendations for risk reduction measures also may be included. Processes are subdivided into sections when conducting PHA studies, for example, into nodes in the case of HAZOP studies, and scenarios are identified for each node. Safety metrics can be used that relate to any of these various aspects of scenarios and for individual nodes, a set of them, or the entire process.
The distributions of scenarios according to scenario risk (Figure 1) and consequence severity (Figure 2) provide an immediate indication of the risk profile for a process that depicts the tolerability of risk. Distributions that are skewed or weighted toward high risks or high consequences are of particular concern. Risk profiles can be compared for different processes at a facility to determine where the risks lie for a facility. Figure 1 shows that there is only a small contribution to total risk from high risk scenarios. However, Figure 2 shows that the contribution of high severity scenarios to total risk is of greater concern and merits further investigation.
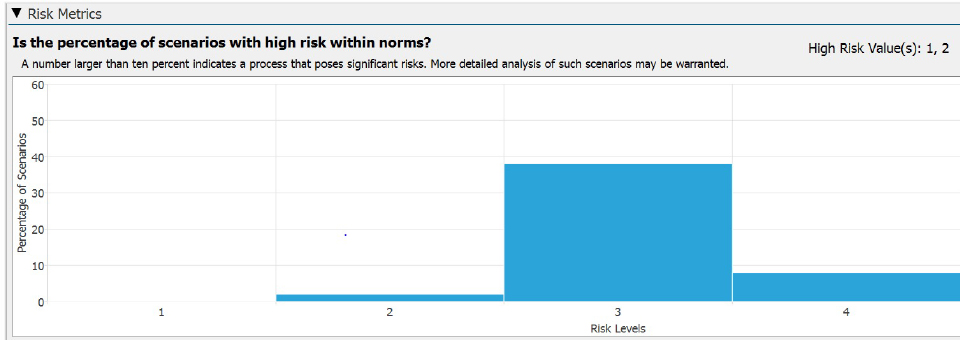
Figure 1. Distribution of Scenarios According to Scenario Risk
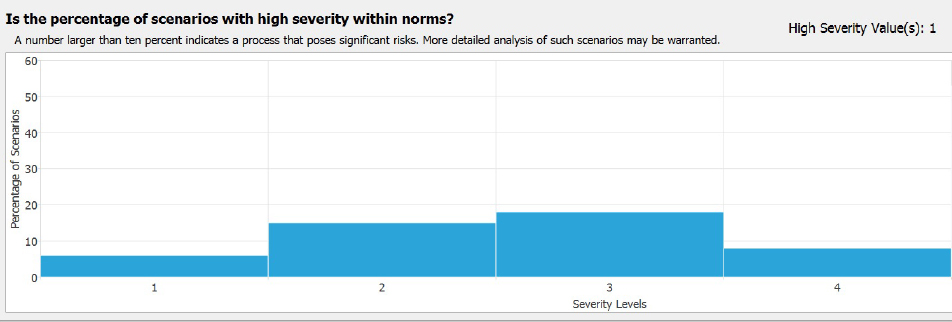
Figure 2. Distribution of Scenarios According to Consequence Severity
A simple safety metric for nodes is the number of scenarios identified for each node (Figure 3). The more scenarios for a node, typically the more attention that should be paid to managing risks for the node, for example, in ensuring safeguards for the node are robust and reliable. Figure 3 shows an ordered list of nodes according to their percentage contribution to the total number of scenarios for the process. Node number 15 is at the top with 7%. The list can be used to determine priorities for addressing the risks from the nodes and whether any nodes merit special attention.
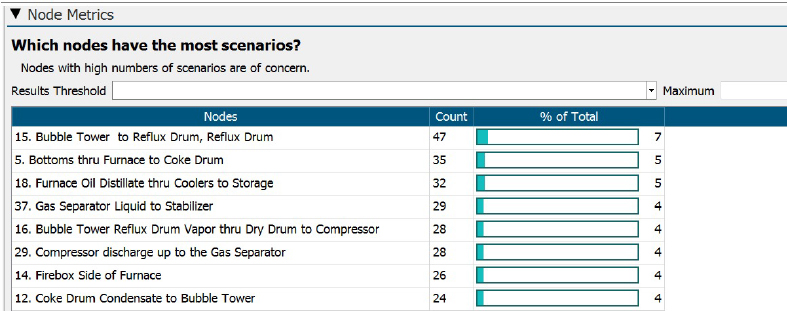
Figure 3. Number of Scenarios Identified for Each Node
However, that is not the whole picture for nodes. Of even more interest, is the number of high risk scenarios for each node and also the percentage of all scenarios for a node that are high risk (Figure 4). It may be that a node has many scenarios but few of them are high risk while another node with fewer scenarios may have a greater number of high risk scenarios. Similarly, two nodes may have similar numbers of scenarios but one of them may have proportionately more high risk scenarios than the other. Figure 4 shows that Node 10 has the highest number of high risk scenarios for the process (30%), and they constitute 18% of all the scenarios for that node. Nodes 5 and 6 are a close second each with 20% of all high risk scenarios for the process. However, they constitute only 6% and 9% respectively of all scenarios for each node.
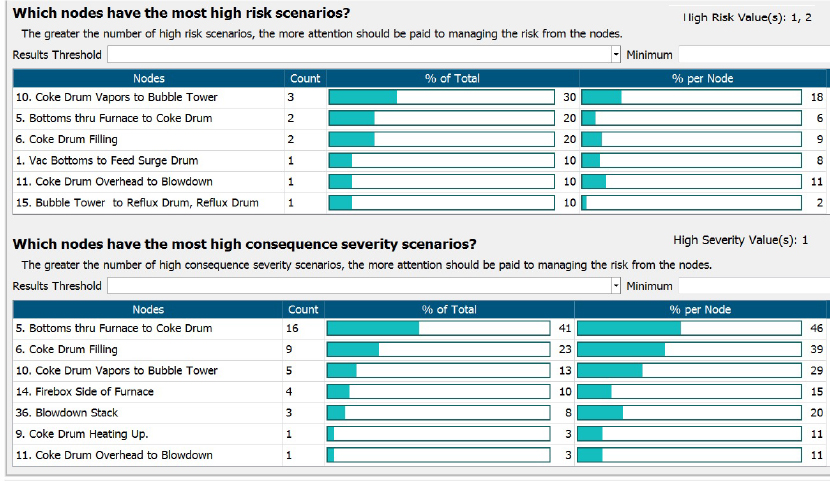
Figure 4. Number of High Risk / Consequence Scenarios for Each Node and the Percentage of All Scenarios for a Node that are High Risk / Consequence
Of further interest are nodes that have the highest number of high consequence scenarios (Figure 4). Often such scenarios are of tolerable risk because their likelihoods are low, that is, they are rare events. However, uncertainties in scenario likelihoods often are large, particularly for rare events, so that actually they may not be of tolerable risk. Therefore, risk management strategies should address such situations. Figure 4 shows that nodes 5 and 6 now rise to the top of the list and some nodes appear that were not present in the high risk list.
Nodes in both these lists merit special attention but nodes 5, 6, and 10 are of particular concern.
Many other safety metrics can be used in addition to node safety metrics. Safety metrics relating to initiating events, that is, the causes of scenarios can provide valuable insights into the nature and manageability of the risks posed. Scenario causes may be equipment failures, human failures, or external events. Usually, equipment failures and human failures dominate. There is an important difference between them in that the likelihood of human failures usually is greater than for equipment failures and the latter are more manageable. Furthermore, human performance can be quite variable. Thus, processes whose risk is dominated by human failures should be of considerable concern. The distribution of scenarios according to the type of cause can be examined for an overall process (Figure 5) or for individual nodes (Figure 6). Processes and nodes with a high number or high percentage of human failures require particular attention.
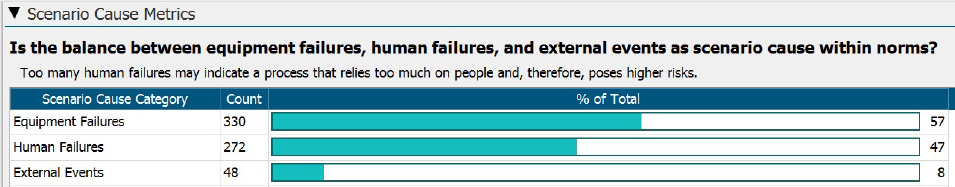
Figure 5. Distribution of Scenarios According to the Type of Cause for a Process
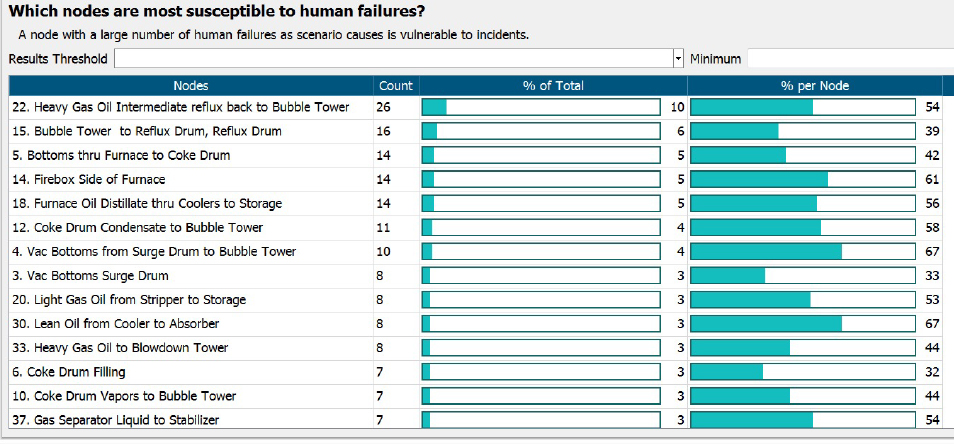
Figure 6. Distribution of Scenarios According to the Type of Cause for Individual Nodes
Figure 5 shows that 47% of all hazard scenarios for the process are attributed to human failures. Effort should be exerted to reduce that percentage. Figure 6 shows that node 22 with 10% of all human failure scenarios is of the greatest concern for human failures. However, other nodes, for example, nodes 4, 30, and 14 have a high percentage of human failures within the node and also merit attention.
Safety metrics for safeguards can examine the number of safeguards per consequence (Figure 7). Norms can be established as ranges that are typical for a particular company or industry so that deviations from the norms require examination and possible remedial actions. Figure 7 shows a wide range, from 0 to 12, for the number of safeguards per consequence for the process. While the average (4) falls above the norm of 2 - 3, the distribution is skewed to the low end and is of concern. Certainly, consequences with zero safeguards need to be reviewed, but those with only 1 or 2 safeguards also bear investigation.
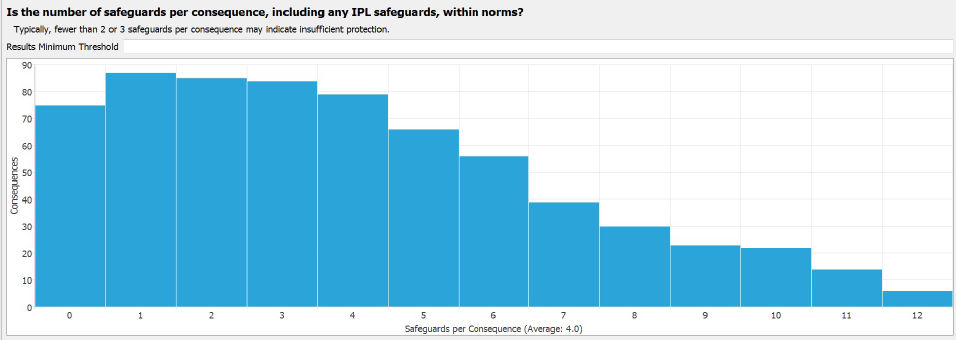
Figure 7. Number of Safeguards per Consequence
Also, an examination can be made of the balance between different types of safeguards, for example, human versus engineered, passive versus active, and prevention versus mitigation. A large number of human safeguards is problematic because of the unreliability of people, passive safeguards are favored over active ones because of their higher reliability, and it is good practice to have a balance between prevention and mitigation safeguards so as not to be overly dependent on either one. Figure 8 shows that a very large number of consequences are protected mostly by human safeguards for the process. This situation is problematic and needs to be addressed to reduce the dependence of the process on human safeguards.
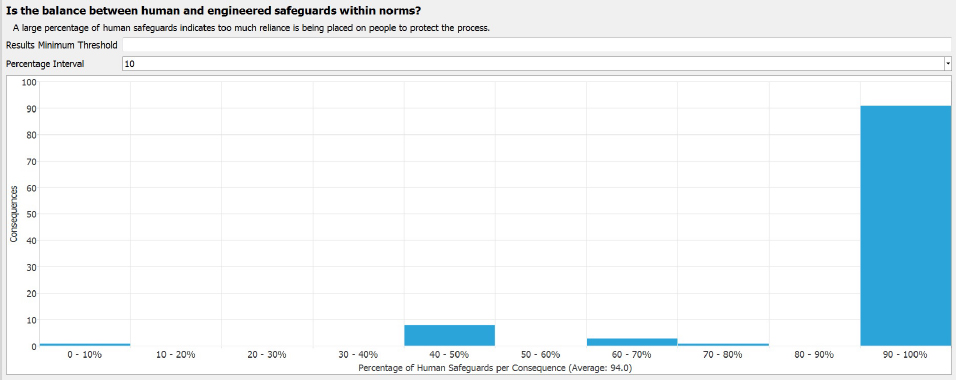
Figure 8. Balance Between Human and Engineered Safeguards
Similarly, safety metrics for recommendations can be calculated as the number of recommendations per node or per scenario. Additional safety metrics can be employed by using even more detailed attributes of PHA scenarios, such as hazardous events, conditional modifiers and other enablers.
Quality Metrics
Given the importance of PHA studies in protecting people, property, and the environment from catastrophic risks, it is essential that the quality of studies be assured. Good PHA practices, including quality assurance approaches, and the use of competent teams are important. However, objective measures of study quality are also needed to monitor the quality of studies as they are conducted to enable any necessary corrections to be made, and to judge the quality of studies on their completion to prevent time consuming rework that can result from subsequent peer review.
Quality metrics are based on aspects of how hazard scenarios are identified and characterized in PHA studies. They provide insights into the quality of PHA studies by comparison with norms that are derived from the population of other completed studies. Departures of quality metrics from norms are investigated to determine if they are warranted and any appropriate remedial actions are taken to improve study quality.
HAZOP studies involve the application of guide words, such as No, More, and Less, to the parameters of a process, such as Flow, Temperature, and Pressure, to identify possible deviations from the design intent for the process, such as No Flow, High Temperature, and Low Pressure, that are investigated to identify hazard scenarios for the process.
In HAZOP studies, the number of parameters per node can be utilized as a quality metric (Figure 9). The number of deviations per node can also be used. Too few may indicate an incomplete study. Figure 9 shows a spread of parameters per node from 1 to 6. Those nodes with only 1 or 2 parameters should be reviewed to ensure parameters have not been overlooked.
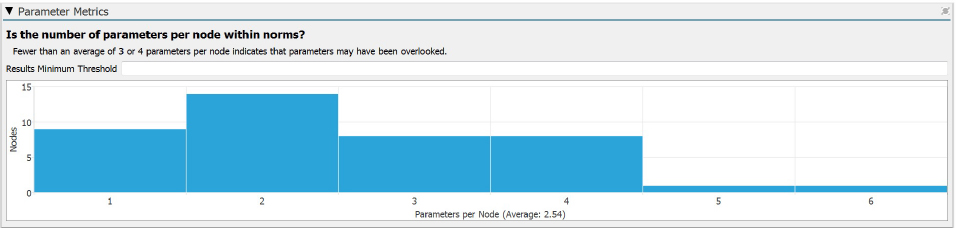
Figure 9. Number of Parameters per Node
Quality metrics based on initiating events, that is, the causes of scenarios, include the balance between the types of causes (Figure 5) and the number of causes per node (Figure 10). Human failures are fairly common so a small number may indicate that some have been overlooked. Sometimes external events are not considered fully so a small number may be indicative of their omission. Significant deviations from the typical range of the number of causes identified for nodes may indicate that causes may have been missed.
Figure 5 shows a large percentage of human failures for the process (47%) but a relatively small percentage of scenarios attributable to external events (8%). It is possible that scenarios involving external events have been missed.
Figure 10 shows that all nodes for the process have fewer causes than the suggested norm of 50 that is specified. Either a poor study was performed or the norm needs to be revised. Regardless of the value used, those nodes with fewer causes than the norm should be examined to ensure causes have not been missed.
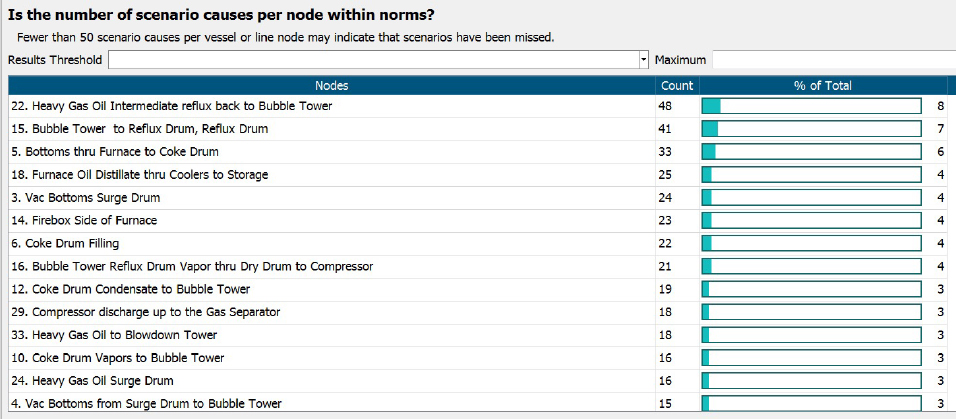
Figure 10. Number of Causes per Node
The number of safeguards per consequence can provide an indication that too much credit is being taken for safeguards or that inappropriate safeguards have been included (Figure 7). Figure 7 shows that some consequences are protected by up to 12 safeguards. Those cases should be examined to see if too much credit is being taken.
Additional quality metrics can be employed using other attributes of PHA scenarios such as hazardous events, conditional modifiers and other enablers.
Use of quality metrics for all PHA studies performed by a company enables the norms used to be refined based on a continually enlarging database of studies whose quality has been managed. This refinement of norms provides for continual improvement in the management of study quality.
Summary
Metrics provide powerful ways of processing PHA study results to obtain insights that otherwise are not readily discerned. Metrics assist in the management of process safety and the quality of PHA studies by comparison with company and/or industry norms.
Safety metrics are used on the completion of PHA studies to assist in the development of risk reduction strategies. They provide more robust and effective decisions on risk reduction than simply considering the risk of individual scenarios, as is often done in PHA. The distribution of risks within a process and across facilities is addressed, the sources and nature of the risks are examined, the appropriateness of safeguards of different types is scrutinized, and the risks of different processes are compared. Consideration of these aspects of process risks enables more appropriate risk management actions to be taken and assists with resource allocation.
Quality metrics are used during the performance of PHA studies and on their completion as part of a PHA quality assurance program. They are based on various characteristics of the hazard scenarios for a process, such as the number and type of scenario causes, and the number and type of safeguards for scenarios.
Safety metrics can show how the origins and nature of risks for a process vary during its lifecycle. Quality metrics help to ensure the consistent quality of PHA studies performed throughout the process lifecycle.
The metrics described in this article were generated using PHAWorks RA Edition® software.
Further Resources
Additional details on metrics can be found in these articles:
Metrics and analytics for process hazard analysis (PHA), Journal of Loss Prevention in the Process Industries, Volume 68, November 2020, 104268.
Safety and quality metrics for process hazard analysis, Process Safety Progress, December 2020, doi.org/10.1002/prs.12222.
Primatech can assist you with all your process safety needs. Please contact us for further information.