Introduction
LOPA is a simplified form of risk assessment. It assists in identifying and determining the adequacy of protection layers for hazard scenarios (see Figure 1). The goal of LOPA is to determine if there is sufficient protection, i.e., if the risk can be tolerated. The term protection layer is used to mean a grouping of equipment and/or administrative and procedural controls that functions in concert with other layers to control process risk, e.g. the barrier layer, or an individual protection measure, e.g. a dike (bund).
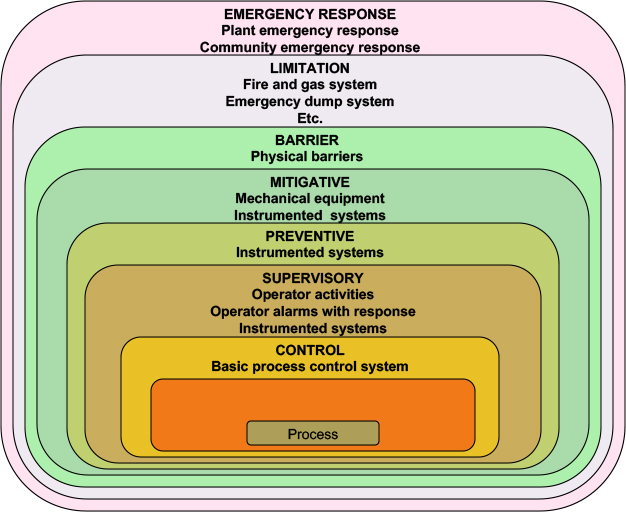
Figure 1. Protection Layers for a Process
LOPA reduces subjectivity in the decision-making process by using rules and well-defined criteria to guide the analysis. This produces more defensible decisions than provided by process hazard analysis (PHA). LOPA helps to focus limited resources on the most critical safeguards and identify safeguards that should be emphasized during employee training, daily operations, and maintenance activities. LOPA does not suggest which specific safeguards to add or which design to choose to reduce risk to tolerable levels. However, it does assist in deciding between alternatives. Without LOPA, there can be a tendency to keep adding safeguards in the belief that the more that are added, the safer is the process. However, this can be a false assumption. Eventually, safeguards will be added that are unnecessary. They reduce the focus on the safeguards that are critical to achieving tolerable risk and add complexity that may result in new, and possibly unidentified, hazard scenarios.
LOPA is used to evaluate the risks of individual hazard scenarios. Each hazard scenario is a set of specific, unplanned events or sequence of events that has an undesirable consequence resulting from the realization of a hazard. As with other forms of risk analysis, risk-informed decisions are made in LOPA by comparing risk estimates with risk tolerance criteria, sometimes called process safety target levels, to determine if there is a risk gap and a need to reduce the existing level of risk to meet the risk tolerance criteria.
LOPA can be used to help resolve the need to implement PHA recommendations for risk reduction. Increasingly, it is also used to determine the Safety Integrity Levels (SILs) required for Safety Instrumented Functions (SIFs) to assist in compliance with industry standards for Safety Instrumented Systems (SISs) such as IEC 61511 / ISA 84.
LOPA can be used at any stage in the process life cycle beginning with early design when process changes can be made more easily. LOPA is a step towards quantification of scenario risk but involves much less effort than Quantitative Risk Analysis (QRA) owing to the simplifying assumptions used. The simplifications are intended to be conservative so that QRA would show lower risk for a scenario than LOPA.
LOPA Approaches
LOPA approaches differ according to how severity and likelihood are evaluated. The simplest approach is to use qualitative estimates for both severity and likelihood. However, such an approach is equivalent essentially to risk ranking in PHA. Since the goal of LOPA is to provide increased confidence over PHA risk estimates, some degree of quantification is desirable. Unfortunately, quantification of the consequence severity is challenging. The calculations are difficult to simplify and they require substantial effort and expertise. Consequently, consequence quantification is not commonly used in LOPA, although some practitioners employ estimates of release quantities to improve on the simple severity estimates used in PHA.
On the other hand, simplified quantification of scenario likelihood is feasible if reasonable approximations are employed. Thus, the most common LOPA approach uses qualitative consequence severity estimates and quantitative likelihood estimates. Usually, only order-of- magnitude estimates are used. This approach requires much less effort than the detailed modeling and calculations used in QRA.
Calculation of Scenario Risk
The elements of a hazard scenario as shown in Figure 2. Scenarios are selected from studies that precede LOPA, such as PHA, using screening criteria, for example, scenarios with the highest risk ranking.
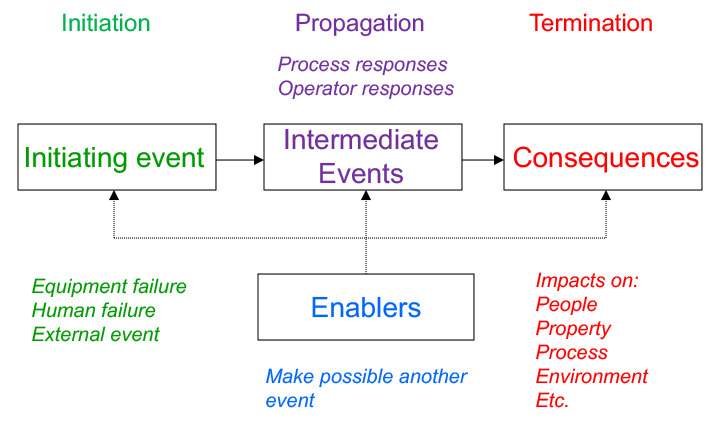
Figure 2. Elements of a Hazards Scenario
Initiating events, safeguards, and consequences for scenarios are defined by these prior studies. Enablers may not have been recorded in prior studies but can contribute significantly to risk reduction and may need to be identified as part of a LOPA study.
Enablers are events or conditions that must be present or active for the scenario to proceed, e.g., an alarm that is bypassed. They do not by themselves initiate hazard scenarios, rather they make them possible. There are some special types of enablers. At-risk factors account for the time period in which a process is at risk, for example, a runaway of a batch reaction can only occur when the reaction is being conducted. Conditional modifiers affect the scenario consequence, for example, the probability that a flammable or explosive material will be ignited; the probability that a person will be present to be exposed to a hazard , and the probability that harm will occur if an individual is exposed .
The risk of a scenario consequence severity is expressed as a frequency, i.e. a rate of occurrence, usually, per year. Typically, the scenario frequency is calculated by multiplying the initiating event frequency for the scenario by the probabilities of the other events in the scenario, including safeguard failures and the presence of enablers. The consequence severity for each hazard scenario is usually estimated qualitatively. The severity level estimated in the PHA risk ranking process may be used, or that estimate may be refined by using release quantity estimates to assign the severity to a category.
Since the severity is usually expressed as a qualitative category or level and the likelihood as a number, the risk is represented by the severity-likelihood couplet rather than a single number. Thus, a scenario may have a severity level 2 with a frequency of occurrence of 1E-4 per year. This represents the LOPA risk of the scenario.
Probabilities are dimensionless numbers. In the context of LOPA, they represent the number of times an event is expected to occur out of the total number of possible occurrences. Typically, such probabilities are described as Probabilities of Failure on Demand (PFDs) since they are used to represent the probability that a protection system will fail to perform a specified function on demand, i.e. the scenario continues towards the undesired consequence despite the presence of the protection system. Thus, PFDs quantify the effectiveness of protection systems. The demand occurs whenever the process reaches a condition where the protection system is called on to function. The lower the value of the PFD, the greater is the confidence it will operate correctly and interrupt the chain of events in the scenario, and the larger will be the reduction in frequency of the undesirable consequence.
In LOPA, PFDs are usually expressed to no more than two significant figures since LOPA uses orders of magnitude estimates for risk but allowance needs to be made for rounding errors. Sometimes, protection system failure data are expressed in other ways. For example, as Safety Availability (SA) (i.e. the probability of success) and as Risk Reduction Factor (RRF). SA = 1 – PFD and RRF = 1 / PFD. Thus, if the PFD is 0.01, the SA is 0.99 and the RRF is 100.
Typically, LOPA is used to analyze the scenario in which all protection layers fail. This can be seen in Figure 3 as the path in the event tree that follows the downward branches. The frequencies of scenarios in this figure can be calculated by multiplying the initiating event frequency by the probabilities of the other events in the path of the scenario, provided that all the events are independent of one another. LOPA depends on this assumption. Therefore, any safeguard that is credited as a protection layer in LOPA must be an Independent Protection Layer (IPL), i.e. its action should not depend on any other aspect of the scenario, such as the initiating event, or the action or failure of any other protection layer associated with the scenario. In practice, additional criteria must be met to qualify safeguards as IPLs. Consequently, not all safeguards are IPLs but all IPLs are safeguards. LOPA takes credit only for IPLs.
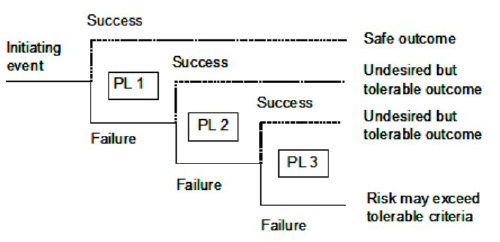
Figure 3. Event Tree Showing the hazard Scenario Typically Analyzed in LOPA
Historically, enablers have not been identified often in PHA worksheets. Sometimes, they are now included if LOPA is to be performed. However, most often LOPA teams will need to identify enablers for scenarios if they are to be included in the analysis.
Enablers are factored into LOPA using their probabilities or multipliers to modify the scenario frequency, either by adjusting the initiating event frequency, or, alternatively, by adjusting the probability of the affected events in the scenario.
Care must be exercised to avoid counting enablers twice. They may have been incorporated into the consequence estimate, e.g. the probability of the operator being present may have been used to adjust the consequence. Double counting will underestimate the scenario risk. Similarly, adjustment for at-risk factors may have been made in the initiating event frequency. For example, a pump may be used for 4 hours each day and failure rate data are collected for the pump over time. It is not appropriate to adjust this failure rate for time-at-risk as the failure rate is already the appropriate rate for this periodic operation of the pump.
If an enabler will definitely occur, e.g. a safety system is permanently bypassed by the operators, its probability is 1. No credit is taken for needing the enabler to occur. It is considered to be part of the scenario description, i.e. it is a given.
For conditional modifiers, the probability of ignition, P (ignition), applies only to fire and explosion scenarios, of course. The probability of personnel being in the affected area, P (present), and the probability of harm from exposure, P (injury), apply in principle, to all scenarios. During some modes of operation, such as startup, operators may always be present and thus P (present) = 1. During the build-up to a hazardous event, more people may be present investigating the symptoms and, therefore, it is likely that P (present) = 1 when the release occurs. Human presence may be correlated with the cause of a hazardous event and it is possible that P (present) = 1 if the person contributes to the initiating event, for example, for a release caused by an operator opening a bleed valve. An initiating event, P (ignition), and P (present) may all be linked. For example, a crane operator may drop a load on the process causing a release. Metal-on-metal sparking or the crane engine provides an ignition source. Thus P (ignition) = 1 and P (present) = 1 as a result of the nature of the initiating event.
Typically, companies develop a database of standard values of initiating event frequencies, enabler failure probabilities / multipliers, and IPL PFDs for use in their LOPA studies. The values used should be applicable for the specific process. For example, higher values should be considered for IPLs installed in severe conditions, e.g. relief valves or sensors in fouling, polymeric, or corrosive service.
Qualifying Safeguards and IPLs
The heart of LOPA is deciding which safeguards qualify as IPLs. Criteria must be specified to make this determination. Historically, three key criteria have been used:
- Effectiveness
- The safeguard protects against the undesired consequence of the scenario when it functions as designed
- Independence
- Safeguard effectiveness must be independent of:
- The occurrence, or consequences, of the initiating event
- Failure of any component of an IPL already credited for the scenario
- Conditions that caused another IPL to fail
- Any other element of the scenario
- Safeguard effectiveness must be independent of:
- Auditability
- The safeguard is designed to enable periodic validation that:
- It is effective in preventing the consequences if it functions as designed
- It achieves the specified PFD
- Design, installation, functional testing, and maintenance systems for the safeguard are in place and working
- The safeguard is designed to enable periodic validation that:
Additional criteria are sometimes used.
The identification of IPLs can be performed as part of PHA or subsequently as part of LOPA. Their identification during LOPA is preferred as the discussion that is required is valuable in helping the LOPA team to understand the scenario and perform the analysis.
The IPL qualification criteria are applied to each safeguard. Commonly, guidelines are used to help teams determine if each qualification criterion is met. For example, checklists have been developed to determine if safeguards meet the effectiveness criterion and for conditions under which human actions may be qualified as IPLs.
In judging the independence of IPLs, the potential for common-cause failures (CCFs) must be considered. CCFs are a specific type of dependent failure where simultaneous (or near-simultaneous) multiple failures result from a single shared cause. Causes of failure can be common between the initiating event and one or more IPLs, or between different IPLs. Credit should be taken for only one of the IPLs where they are affected by CCF. Where safeguards are dependent, and only one of them can be credited as an IPL, the one with the highest PFD may be selected to be conservative. For example, in the case of a process that is protected by an emergency vent (PFD = 0.01) and a relief valve (PFD = 0.001) that do not operate independently, credit may be taken for the emergency vent. Alternatively, credit could be taken for the safeguard that receives the first demand.
Some LOPA worksheets use check boxes to show that qualification criteria have been met. Careful consideration should be given to the qualification criteria for each candidate IPL. A rush to judgment must be avoided. This process takes more time than is required for deciding what credit to take for each safeguard in PHA.
Risk Tolerance Criteria
Usually, it is not possible to eliminate all risk from an activity unless the activity itself is eliminated. Consequently, criteria are needed to specify levels of risk that can be tolerated. Risk tolerance criteria are standards used for comparison with estimated risk to determine its acceptability and assist in decisions on whether further efforts to reduce risk are warranted. No level of risk is viewed as truly acceptable by some people so usually the term tolerable is employed. The residual risk is the risk that remains after controls have been implemented. It must be tolerable for continuance of an activity.
Risk tolerance criteria may be qualitative or quantitative in nature but must correspond to the form of the risk estimates used in LOPA. They may be depicted explicitly, for example, using defined numerical criteria, or they may be displayed implicitly, for example, in a risk matrix. Commonly, they are defined as tolerable frequencies for each consequence severity level for a hazard scenario, e.g. a tolerable frequency of 1E-5 per year for a fatality.
More complex risk tolerance criteria may be needed that set limits for summations of the risk of multiple scenarios, e.g. those that contribute to a specific hazardous event or those that result in the same consequence for a process or facility. Such criteria represent maximum tolerable cumulative risks. Scenario risk criteria are easier to understand but cumulative risk criteria are more representative of the total risk and their use ensures that decisions are not based exclusively on individual scenarios which can result in inappropriate risk reduction decisions.
Comparison of Risk Estimates with Risk Tolerance Criteria
Scenario risk estimates are compared with risk tolerance criteria to determine if additional risk reduction is required to reach a tolerable level. Typically, the risk reduction required (RRR) is calculated by taking the ratio of the risk tolerance criterion, or tolerable risk (TR), to the frequency of the hazard scenario, or estimated risk (ER), i.e. RRR = TR / ER. If the estimated risk is less than the risk tolerance criterion, the situation is judged to be of sufficiently low risk, i.e. there is sufficient protection so that no further protection is needed. If the estimated risk exceeds the risk tolerance criterion, the scenario is judged to require stronger protection or additional protection, i.e. design changes are needed to make the process safer.
Once the risk gap has been determined, the primary objective of LOPA has been met. However, at some point, the means to reduce the risk to tolerable levels must be determined. Some companies incorporate that effort into the LOPA study and develop recommendations for risk reduction to eliminate risk gaps.
Recording and Documenting Studies
LOPA study results can be recorded in a PHA worksheet (see Figure 4) or in a separate LOPA worksheet (see Figure 5).
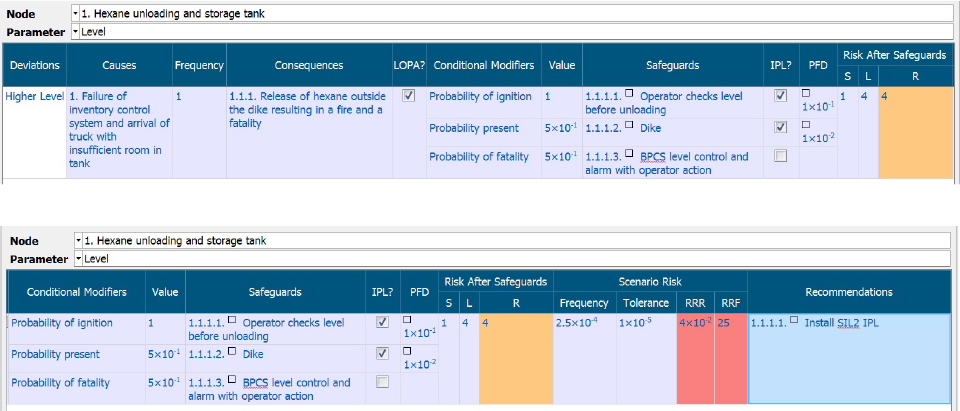
Figure 4. Example of LOPA in a PHA Worksheet
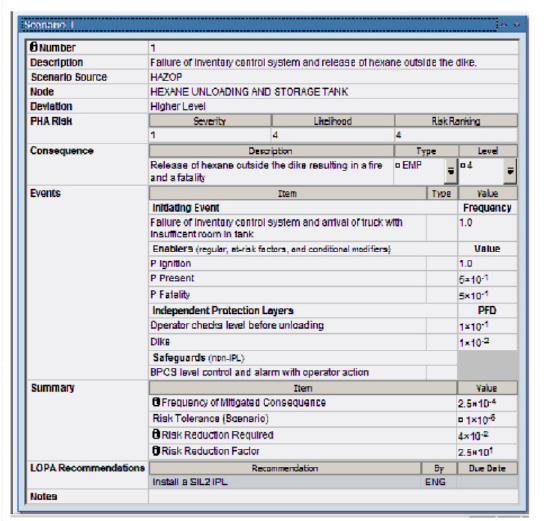
Figure 5. Example of a LOPA Worksheet
The advantage of using a PHA worksheet is that the LOPA information appears together with the PHA scenario and a single worksheet is used. However, the PHA worksheet is made more complex and more worksheet columns must be displayed.
The advantage of using a separate LOPA worksheet is that more LOPA information can be included and the focus is on each scenario. However, the context of the scenario within a PHA is absent.
Regardless of the type of worksheet used, LOPA and PHA are two separate types of studies involving different types of thought processes and, therefore, it is not a good idea to fully integrate the studies. If a LOPA study is recorded in PHA worksheets, it is best to perform LOPA after all scenarios have been identified.
LOPA worksheets are used in various ways:
- Review by the team leader and team members
- Reference by team members during the study
- Quality control review
- Generation of actions on risk reduction
- Review by interested parties on completion of the study, e.g., regulators
- Revalidation of LOPA studies
Various tools can be used to document LOPA studies including:
Software improves the efficiency and effectiveness of recording studies and helps to avoid the need for team review, comments, and editing of paper worksheets.
In addition to LOPA worksheets, a comprehensive written report should also be prepared to ensure the LOPA study is properly documented. The report must be clear, accurate, and complete as it will be used by people who were not part of the study team, for example, to follow-up on study recommendations. It provides a permanent record of the study and proof that the study was conducted. It is prepared after the study is completed. The report is also needed for auditing, periodic revalidation, management of change (MOC) reviews and reference by stakeholders.
Typical report contents include:
- Summary of the study results
- List of recommendations made
- Process description
- Study purpose, scope, and objectives
- Description of LOPA approach used
- How the study was conducted
- Who participated
- Assumptions made
- References to failure data used
- LOPA worksheets for scenarios analyzed
- Copies of reference materials used during the study
Some practitioners include these items in the PHA report rather than preparing a separate LOPA report.
Revalidating LOPA Studies
Government regulations and industry standards require that PHAs be revalidated periodically, typically, at least every 5 years. Revalidation involves updating the PHA to account for changes that have been made to the process. Usually, LOPA is directly connected to PHA. Therefore, it is good practice to revalidate LOPA studies too.
Further Resources
Layer of Protection Analysis, Wiley, 2001.
Guidelines for Developing Quantitative Safety Risk Criteria, Wiley, 2009.
“Risk tolerance criteria for layers of protection analysis”, Process Safety Progress, Vol. 31, No. 2, pages118–121, June, 2012.
Conducting process hazard analysis to facilitate layers of protection analysis, Process Safety Progress, Vol. 31, No. 3, pages 282–286, September, 2012.
Using risk tolerance criteria to determine safety integrity levels for safety instrumented functions, Journal of Loss Prevention in the Process Industries, 25 (6), pages 1000 - 1009, 2012.
Layers of Protection Analysis, in Handbook of Loss Prevention Engineering, Wiley-VCH, Weinheim, Germany, 2013.
Guidelines for Enabling Conditions and Conditional Modifiers in Layer of Protection Analysis, Wiley, 2013.
Addressing enablers in layers of protection analysis, Process Safety Progress, Vol. 33, Issue 3, pages 221–226, September 2014.
Guidelines for Initiating Events and Independent Protection Layers for LOPA, Wiley, 2014.
Overcoming challenges in using layers of protection analysis (LOPA) to determine safety integrity levels (SILs), Journal of Loss Prevention in the Process Industries, Volume 48, pages 32 – 40, July 2017.
Primatech can assist you with all your process safety needs. Please contact us for further information.