Introduction
Bow tie diagrams provide a visually intuitive and readily understood depiction of hazard scenarios that share a common hazardous event. They depict how scenario causes (called threats in bow tie analysis) can lead to a loss of control of a hazard leading to adverse consequences (called impacts in bow tie analysis) . They also identify safeguards (called barriers in bow tie analysis) for the prevention and mitigation of scenario pathways between threats and consequences. Bow tie diagrams resemble a man’s bow tie neckwear (see simple generic bow tie diagram in Figure 1). There is a time progression from the left to the right side of the diagram.
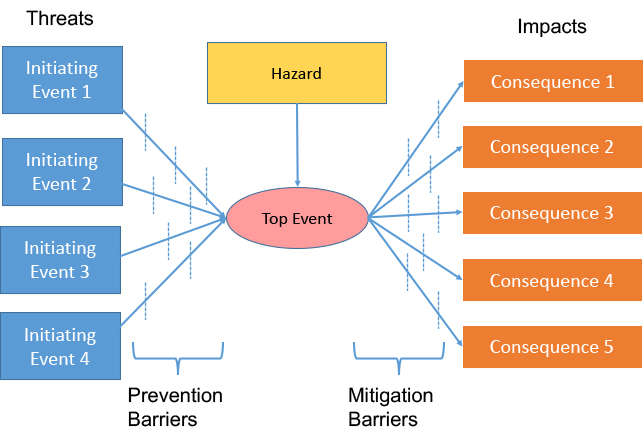
Figure 1. Simple Generic Bow Tie Diagram
Threats appear on the left side of the diagram and consequences appear on the right side . The focal point of the diagram is the specific loss (top event) that results from a hazard and ties together the threats and impacts. Prevention and mitigation barriers are shown on either side of the loss event. Prevention barriers act to stop the top event from occurring. Mitigation barriers act to reduce the severity of the consequence should the top event occur. Some barriers may apply to more than one cause.
A glossary of bow tie terms is provided for reference at the end of this article.
Elements of Bow Tie Diagrams
A more detailed generic bow tie diagram is shown in Figure 2. An example of an actual bow tie diagram is provided in Figures 3 and 4.
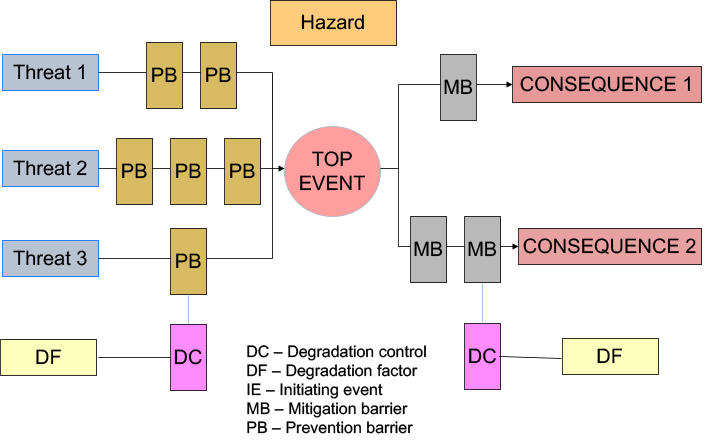
Figure 2. Detailed Generic Bow Tie Diagram
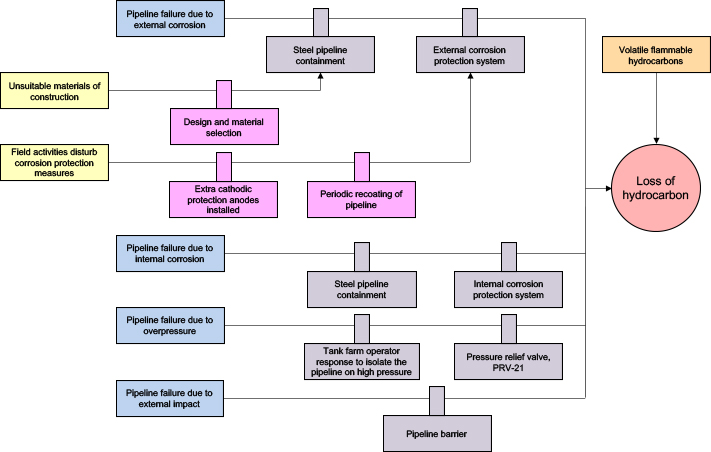
Figure 3. Actual Bow Tie Diagram - Prevention Pathway
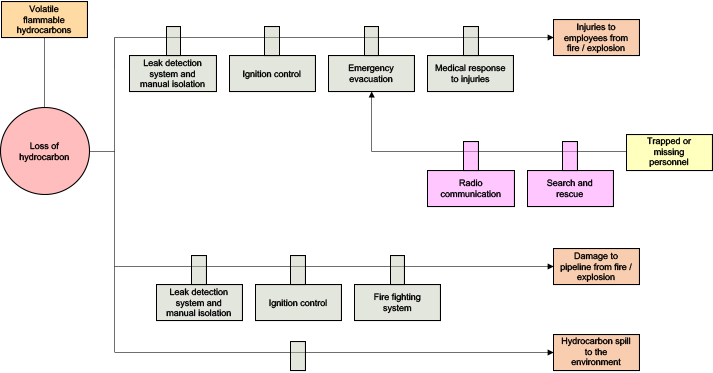
Figure 4. Actual Bow Tie Diagram - Mitigation Pathway
The hazard provides clarity as to the source of risk and it defines the coverage of the bow tie diagram, i.e. the hazard scenarios contained within it. Usually, there are multiple threats for each top event and one top event may have multiple consequences. Bow tie analysts identify threats and consequences by consulting PHA studies and sometimes by brainstorming additional threats that may be missing from PHA studies.
The top event for a bow tie diagram is shared by all threats and consequences in the diagram. Each path from a threat to the top event and from the top event to a consequence represents a single hazard scenario.
Barriers are placed on the bow tie diagram in the time sequence of their operation, i.e. the order in which they are called upon to function. Barriers are the central element of a bow tie diagram.
Figure 2 show degradation factors and degradation controls. Degradation factors are conditions that can reduce the effectiveness of the barrier to which they apply. They do not directly cause the top event but increase its likelihood. Degradation controls are measures that support main pathway barriers against a degradation factor. They lie along a degradation pathway but do not directly prevent or mitigate the top event. Degradation factors are drawn in the bow tie diagram below the barrier to which they apply. They appear only on a degradation pathway leading to a barrier and can apply to barriers on either side of the top event.
A simple safety metric for nodes is the number of scenarios identified for each node (Figure 3). The more scenarios for a node, typically the more attention that should be paid to managing risks for the node, for example, in ensuring safeguards for the node are robust and reliable. Figure 3 shows an ordered list of nodes according to their percentage contribution to the total number of scenarios for the process. Node number 15 is at the top with 7%. The list can be used to determine priorities for addressing the risks from the nodes and whether any nodes merit special attention.
Multiple degradation controls can apply to a single degradation factor and multiple degradation factors can apply to a single barrier. Degradation controls can be degraded by their own degradation factors.
Bow tie analysis can be performed at different levels. A basic analysis identifies only the hazard, top event, threats and consequences. A standard bow tie adds barriers to the basic bow tie but without degradation factors and controls. An extended bow tie adds degradation factors and controls to a standard bow tie.
Benefits of Bow Ties
Bow tie diagrams offer multiple benefits including:
- Provide a readily understood and simple visualization of the hazard scenarios that produce a top event and the safeguards in place to protect against them. The picture provided is much clearer than examining PHA worksheets.
- Provide a deeper analysis of barriers and controls than in PHA.
- Highlight important safety barriers which allows operations and maintenance personnel to focus on those barriers and controls most needed to prevent the adverse consequences of process safety incidents.
- Document how safety barriers may fail and the processes and systems in place to prevent failures. This provides a framework to use in managing barriers.
Uses of Bow Tie Diagrams
Bow tie diagrams have a number of important uses including:
- Communication of hazards to stakeholders
Stakeholders include management, workforce personnel, barrier owners (operations, maintenance, etc.), contractors, and regulators. Bow tie diagrams are easily understood by non-experts because they are conceptually simple and provide a pictorial representation of hazard scenarios for a process and how they are controlled. Their level of detail can be adjusted according to the audience. - Barrier Analysis
During the design phase, bow ties can be used to determine the adequacy and relevance of planned barriers and decide if additional barriers and controls are needed. During the operational phase, bow tie diagrams highlight key barriers and help to communicate barrier information to involved personnel. They provide a tool to continually monitor barrier effectiveness and assist in decision making on actions needed when barriers become inoperative or are degraded.Barrier analysis enables a number of important questions to be addressed regarding barriers, including:
Is any one person responsible for too many barriers?
Is the combination of barrier types appropriate?
Is the strength of barriers sufficient?
Is there defense in depth?
Is there a balance between prevention and mitigation barriers?
Are any pathways protected entirely by human barriers? - Barrier management
Barrier management is the process of ensuring that barriers are capable of protecting against losses, properly implemented, in service (not disabled or bypassed), and supported and maintained so that they function as expected when needed. Barrier management is important because process safety incidents usually involve barrier failure, reliance is often placed on implicit barriers that are assumed to be in place without verification, and there is a history in the process industries of barriers degrading after process commissioning.
Barrier management is used to ensure performance standards for critical barriers are set and met for both engineered and human barriers and that barrier performance is monitored. Barrier management is essential if reliance is to be placed on barriers to protect against process safety incidents.
Bow tie analysis facilitates the identification of critical barriers and clarifies which barriers are relied upon to prevent incidents. It provides the basis for a barrier management plan.
- Identification of safety critical equipment
The failure of safety critical equipment can cause or contribute to major process safety incidents. Therefore, it should receive prioritized attention over other equipment. Typically, items of safety critical equipment are part of barriers. Bow tie analysis can be used to set performance standards and prioritize inspections, tests, maintenance, and repair for safety critical equipment, such as safety instrumented systems, fire protection systems, and high pressure equipment.
- Identification of safety critical tasks
Safety critical tasks involve actions that are essential to activate or maintain barriers, for example, manual activation of emergency shutdown , or to perform an activity correctly to protect against an incident, for example, the correct sequencing of manual valves. Human or organizational factors may operate to cause human errors. Safety critical tasks typically are part of barriers. The incorrect or lack of execution of safety critical tasks prevents the correct functioning of barriers.
Bow tie analysis can be used to identify and prioritize safety critical tasks. This information can be provided to operations and maintenance personnel so they are aware of the most important tasks they are responsible for and the consequences of incorrect task execution. The information also can be used in the development of procedures, the establishment of personnel competency requirements, and the training of facility personnel.
- Safety management
Bow ties can support many process safety elements. For example, they provide a list of barriers and controls to aid prioritization of inspection, testing, maintenance, and repair of equipment in a facility’s asset / mechanical integrity (AI / MI) program.
- Incident investigation
Bow tie analysis can play a role in incident investigation. Bow ties display those barriers that were thought to be in place when an incident occurred and can be used to support the analysis of why barriers failed and allowed the incident to occur. The ability of existing barriers and degradation controls to prevent future incidents also can be judged. Bow ties can help in sharing lessons learned from an incident and they can enhance incident investigations by identifying patterns of barrier failure across incidents.
Relationship of Bow Tie Analysis to Process Hazard Analysis (PHA)
Unlike PHA, bow tie analysis does not attempt to identify all hazard scenarios for a process. Bow tie diagrams are constructed from a known set of scenarios, sometimes supported by brainstorming to add missing ones.
A bow tie diagram displays a small set of hazard scenarios from a process. Typically, individual bow tie diagrams will be constructed for the most important top events from a PHA study. Usually, there will be multiple important top events and thus multiple bow tie diagrams for a process.
Typically, bow tie analysis explores degradation factors and controls, unlike PHA. Thus, it can provide a fuller list of barriers than PHA.
Summary
Bow-tie analysis provides a valuable pictorial representation of process hazards. It can be used for various purposes. In particular, bow tie diagrams communicate the hazards of a process very well to facility personnel and they provide an effective tool for managing the performance of barriers and controls.
The bow tie diagram shown in this article was generated using PHAWorks RA Edition® software.
Further Resources
Bow Ties in Risk Management, Wiley, New York, NY, 2018.
Bow-Tie Industrial Risk Management Across Sectors: A Barrier-Based Approach, Luca Fiorentini, Wiley, 2021.
Glossary of Bow Tie Terms
Barrier: A control measure or grouping of control elements that on its own can prevent a threat developing into a top event (prevention barrier) or mitigate the consequences of a top event once it has occurred (mitigation barrier).
Barrier Pathway: See Main Pathway.
Consequence: The undesirable result of a loss event, usually measured in health and safety effects, environmental impacts, loss of property, and business interruption costs
Degradation Control: Acts to mitigate a degradation factor. A measure that helps to prevent a degradation factor from impairing a barrier. Degradation controls lie on the pathway connecting the degradation threat to the main pathway barrier. Degradation controls may not meet the full requirements for barrier validity.
Degradation Factor: Impairs or causes the failure of a barrier. A situation, condition, defect, or error that compromises the function of a main pathway barrier through either defeating it or reducing its effectiveness. If a barrier degrades then the risks from the pathway on which it lies increase or escalate, hence the alternative name of Escalation Factor. Also, known as Degradation Threat .
Degradation Pathway: An arm connecting degradation factors to a main pathway barrier. They contain degradation controls.
Degradation Threat: See Degradation Factor.
Escalation Factor: See Degradation Factor.
Hazard: A potential source of harm. An operation, activity, or material with the potential to cause harm to people, property, the environment or business.
Impact: See Consequence.
Main Pathway: An arm connecting a threat to the top event, or the top event to a consequence. The arms contain barriers. See Prevention Pathway and Mitigation Pathway.
Main Pathway Barrier: A barrier that lies along the direct route from a threat to the top event or from the top event to a consequence. Also called a Primary Barrier.
Mitigation Barrier: A safeguard that stops the scenario before the consequence occurs or reduces the consequence severity. Also called reactive, recovery, or defence barrier. It is located on the right-hand side of a bow tie diagram lying between the top event and a consequence.
Mitigation Pathway: An arm connecting the top event to a consequence. The arm contain mitigation barriers.
Pathway: An arm on which barriers or degradation controls are located. See Main Pathway, Prevention Pathway, Mitigation Pathway, Barrier Pathway, and Degradation Pathway.
Post-event side: The right side of a bow tie diagram from the bow tie to the consequences.
Pre-event side: The left side of a bow tie diagram from the threats to the top event.
Prevention Barrier: A safeguard that stops threats that result in the top event. Also called proactive barrier. It must have the capability to completely terminate a threat sequence on its own. It is located on the left-hand side of a bow tie diagram lying between a threat and the top event.
Prevention Pathway: An arm connecting a threat to the top event. The arm contains prevention barriers.
Threat: An initiating event that can cause the top event. Also called Cause.
Top Event: An event in which loss of control of the hazard occurs. It is a central event in a bow tie diagram lying between a threat and a consequence corresponding to the moment when there is a loss of control or loss of containment of the hazard. The term derives from Fault Tree Analysis where the unwanted event lies at the top of a fault tree that is then traced downward to more basic failures, using logic gates to determine its causes and likelihood.
Primatech can assist you with all your process safety needs. Please contact us for further information.