Introduction
Process hazard analysis (PHA) studies (e.g. using the hazard and operability (HAZOP) study) identify hazard scenarios and each scenario is examined individually to decide whether risk reduction measures are needed. However, much more can be done to benefit from the contents of studies.
PHA studies contain so much data that a manual review is precluded from yielding insights into their results. Fortunately, valuable information can be extracted using analytics that consider all the contents of a PHA study. The management of safety, operability, reliability, utilization, and loss prevention can all be improved.
The purpose of using analytics in process safety is to improve decision making regarding the management of process risks. Rather than focusing decision making on the risks of individual hazard scenarios, as is common practice, analytics enable a deeper analysis of the entire set of scenarios for a process. This enables better decisions to be made on where and how risk reduction resources should be allocated. For example, analytics can be used to identify high risk process areas, provide granularity on the sources of risks, and show the relative importance of individual safeguards and in so doing more attention can be paid to those aspects of the process that are most important for risk reduction.
Also, analytics can provide insights that are typically hidden, or not considered, in conventionally conducted PHA studies. For example, sets of scenarios can be compared for different parts of a process or across processes to identify overlooked scenarios. Furthermore, analytics can be used to prioritize maintenance, training, and other activities.
An important aspect of using analytics is presenting information in a visual form that facilitates comprehension and understanding of PHA study results in a way that is not possible simply by reading PHA worksheets. Data visualization is a key aspect of ensuring the utility of analytics.
The information contained in PHA studies usually is developed by a company’s most experienced personnel and its generation requires a substantial investment of time and resources. Analytics can be used to maximize the return on this investment.
This article describes various analytics for PHA studies and provides examples that illustrate their use.
PHA Analytics
Analytics provide views into PHA study results from a variety of different perspectives Many different analytics can be used to provide insights into the results of studies that help with risk management decisions. Some examples are provided below.
Comparison of Risks Within and Across Processes
The risks from a process may not be uniformly distributed across the process. Different nodes may pose different levels of risk. Naturally, those nodes posing the highest risks are of most concern. The distribution of risks according to the type of hazard, such as fire, explosion, and toxic release, or the type of consequence, such as impacts on people, property, or the environment may also help inform decisions on risk reduction measures. These distributions can be examined for an entire process or nodes within it.
By way of example, Figure 1 shows scenario cause counts by risk and severity levels for a process. The distributions are skewed somewhat to the low risk / low severity end (the risk ranking scheme for the project has 9 risk levels with low risk values at the high end of the scale and 5 severity levels with low severity values at the high end of the scale) but there are certainly scenario causes towards the high risk / severity end that merit further study to ensure all appropriate measures have been taken to address them. For example, causes with a risk level of 4 and a severity level of 2 bear further investigation.
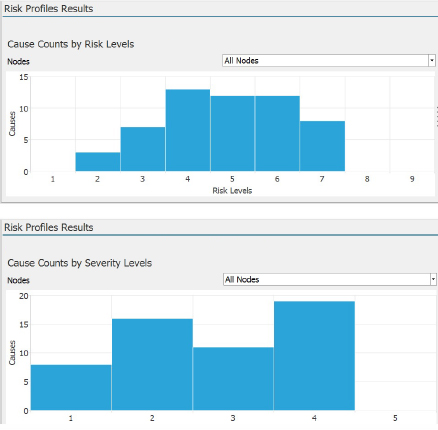
Figure 1. Scenario Cause Counts by Risk and Severity Levels for a Process
Also, overall risk profiles can be compared for different processes at a facility or across a company. Certainly, those processes with higher risks merit more attention. However, more detailed risk profiles, such as those described above, may reveal areas of concern for lower risk processes that are not evident from the overall risk profiles. For example, one process may be more susceptible to human failures, which are notoriously difficult to address, or another process may pose more risk from toxic releases than other processes, which are of concern because of the risks to the public. Such considerations result in a more equitable allocation of risk reduction resources than simply considering risk reduction for each process individually, as is the common practice today.
Furthermore, the comparison of PHA studies for similar processes can help with quality control of PHA studies. Any differences between study results for different processes may be attributable to genuine differences in the design, operation, maintenance, etc. of the processes. However, they may also be attributable to variations in the quality of studies including the possible omission of scenarios. Consequently, the examination of studies on similar processes using analytics is a worthwhile endeavor.
Safeguards Management
The key concern in a PHA study is whether or not existing safeguards adequately protect the process. Decisions are made on the adequacy of existing safeguards for each scenario based largely on a risk ranking or risk estimate for the scenario. These risk estimates are holistic measures of the contributions to risk reduction for all the safeguards protecting a scenario. However, there are various characteristics of individual safeguards that should also be factored into decision making on their adequacy in providing risk reduction.
For example, the hierarchy of controls, in which safeguards are ordered beginning with the most effective (inherent safety) and proceeding to the least effective (emergency response), can be analyzed to provide a useful perspective on the appropriateness of safeguards for a process and its individual nodes. Figure 2 shows a hierarchy of controls analysis (HCA) for a process. The profile skews to the top, as is desirable, although dependence on Personal Protective Equipment (PPE) is higher than desirable.
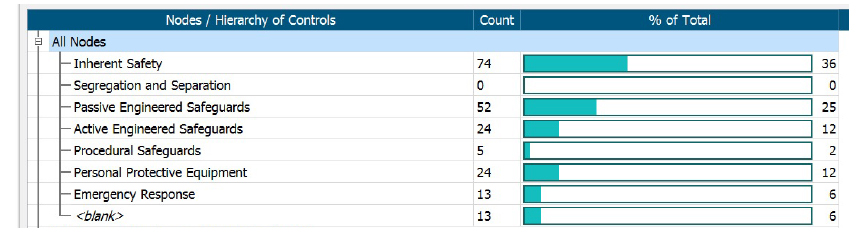
Figure 2. Hierarchy of Controls Analysis (HCA) for a Process
Figure 3 compares the HCA profiles for Nodes 1 and 2. The profile for node 2 is better than for Node 1 as it skews more to the top of the hierarchy. Of course, other factors may be important, such as the number of scenarios protected by each safeguard and the risks of the scenarios.
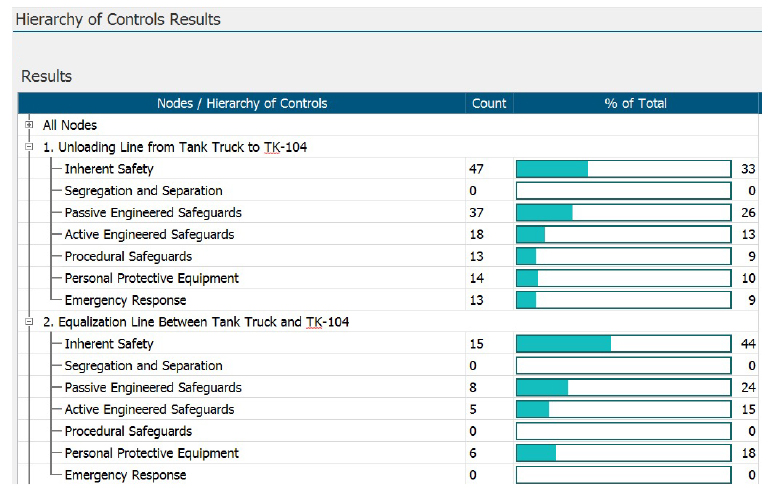
Figure 3. Comparison of HCA Profiles for Two Nodes
Figure 4 shows such data where safeguards are ordered by the number of scenarios that they protect. It can be seen that safeguard 26 appears in 60 scenarios, far more than other safeguards. It protects scenarios with risk values up to 2 and severity values up to 1 making it an important safeguard. The risk distribution for the safeguard skews a little towards low risk but, of some concern, is that the severity distribution does not. Each safeguard can be studied with this analytic to assist in identifying those that are most important for the process.
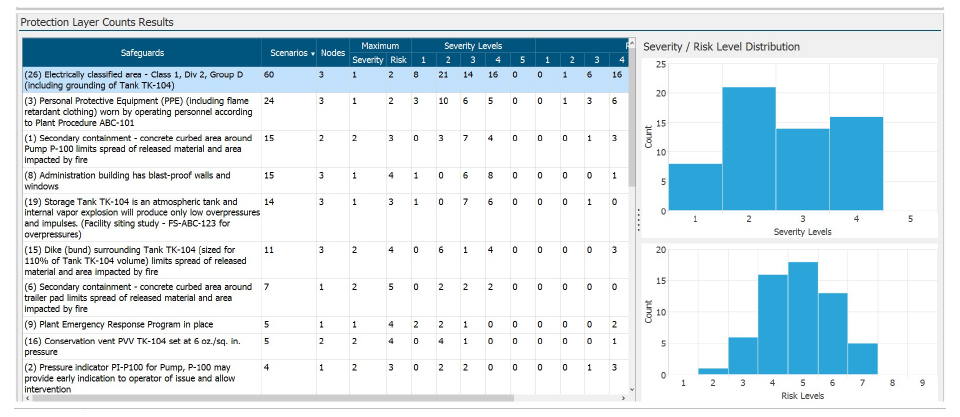
Figure 4. Number of Scenarios Protected by Each Safeguard
Also of interest is the number of safeguards that protects each risk level for the entire process and for individual nodes. Figure 5 shows a risk profile for safeguards for the entire process. The highest risk scenarios identified for the process (risk level 2) are protected by only three safeguards. These scenarios should be examined to determine whether the safeguards are sufficiently robust, particularly PPE, and whether additional safeguards are merited. The same can be done for individual nodes.
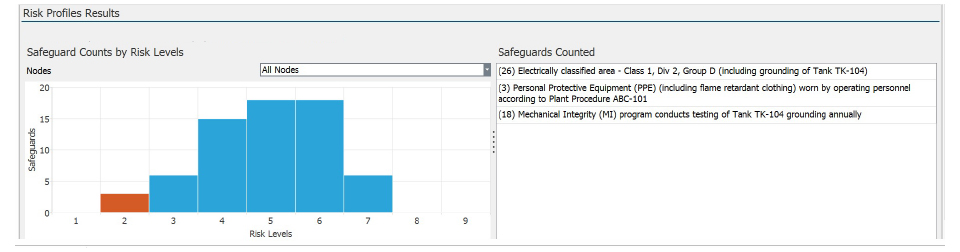
Figure 5. Number of Safeguards that Protect Each Risk Level
An analysis of safeguards by type also is of value. For example, safeguards can be characterized as engineered or human, active or passive, and preventive or mitigative. Figure 6 shows such an analytic. More safeguards are characterized as active than any other category, followed by human. Passive and engineered safeguards would be preferred. In third place are preventive safeguards, which are preferred to mitigative safeguards, which act after a hazard has been realized. An examination of the severity and risk distributions for active safeguards in Figure 17 shows that the severity levels skew to low severity. The risk levels skew in the same direction but the distribution is more centered. Such distributions do not indicate undue concern.
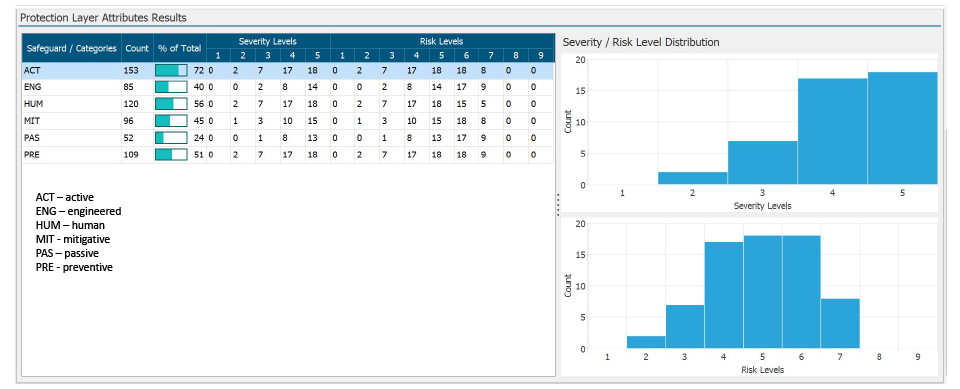
Figure 6. Safeguards Analysis by Type
Critical Items Analysis
An important use of PHA study results is the identification and prioritization of critical equipment to support inspection, testing and maintenance as part of asset / mechanical integrity (MI) programs, and critical human actions to support the development and improvement of operating, maintenance, and other procedures, such as those for emergency response. Analytics can assist greatly in this use of PHA study results. Some of the analytics described in the previous section are important for this application but additional analytics are useful too, for example, a listing of safeguards according to the risk levels of scenarios that they protect. Figure 7 provides an example. Safeguards for high risk scenarios that protect multiple scenarios, for example, safeguard 26 under risk level 3, should be assigned a high priority in a MI program.
Similar analyses can be performed to identify critical causes, hazards, and receptors.
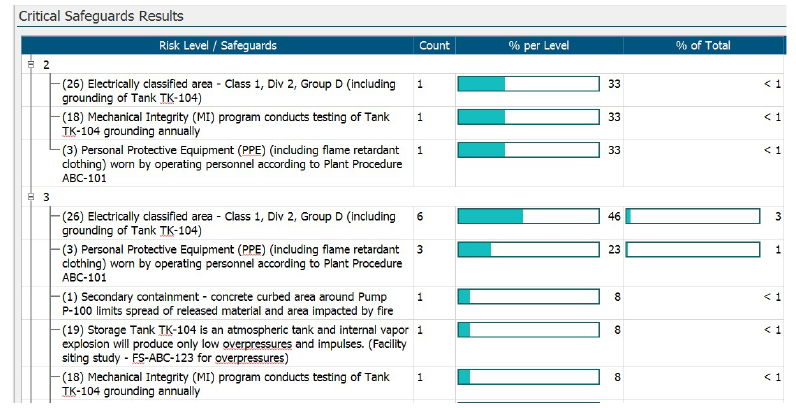
Figure 7. Critical Safeguards Analysis
Summary
Analytics provide powerful ways of processing PHA study results to obtain insights that otherwise are not readily discerned. Analytics can be used throughout the process lifecycle, including during process design, for existing processes in their various operating modes, and for process changes. They facilitate monitoring variations in high risk process areas, sources of risks, the importance of safeguards, and other process characteristics that impact on risk management.
The use of PHA analytics maximizes the return on an organization's investment in PHA studies.
The analytics described in this article were generated using PHAWorks RA Edition® software.
Further Resource
Additional details on analytics can be found in this article:
Metrics and analytics for process hazard analysis (PHA), Journal of Loss Prevention in the Process Industries, Volume 68, November 2020, 104268.
Primatech can assist you with all your process safety needs. Please contact us for further information.